Dashboard
Real-Time Quality Measure and CASPER Report
Many skilled nursing facilities will routinely run their CMS CASPER (Certification And Survey Provider Enhanced Reports) on a monthly or quarterly basis. These reports give providers direct access to quality measures, payroll-based journal, and other statistics that directly impact the facility Nursing Home Compare Five Star rating. The quality measure data in the CASPER reports is driven off of submitted MDS 3.0 assessments.. Unfortunately, MDS data is often gathered only every 90 days and therefore getting real-time clinical conditions for a resident population is difficult even if a provider runs the CASPER reports on a daily basis.
Don’t rely on stale MDS data. Track CMS quality measures in real time.
The Real-Time Quality Measure and CASPER Report spans your electronic medical record system, giving you instant access to quality measure data and much more. This dashboard using direct access to your electronic medical record system and simulates completing an MDS on every resident in your facility in real-time. You can get predicted results comparable to both the CASPER’s “Facility Quality Measure Report” and the “Resident Level Quality Measure Report”
With the Real-Time QM and CASPER Report:
- You will always know whether your nursing home is at risk of a star rating drop or on the verge of boosting its score.
- Your team can identify potential trouble spots before they become unmanageable.
- The data you need to complete the MDS will be right at your fingertips.
Dashboard Features
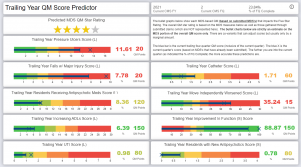
QM Score Predictor
Gives an assessment of your CMS Quality Measure score in real-time, so you can see where your facility shines and where it must improve.
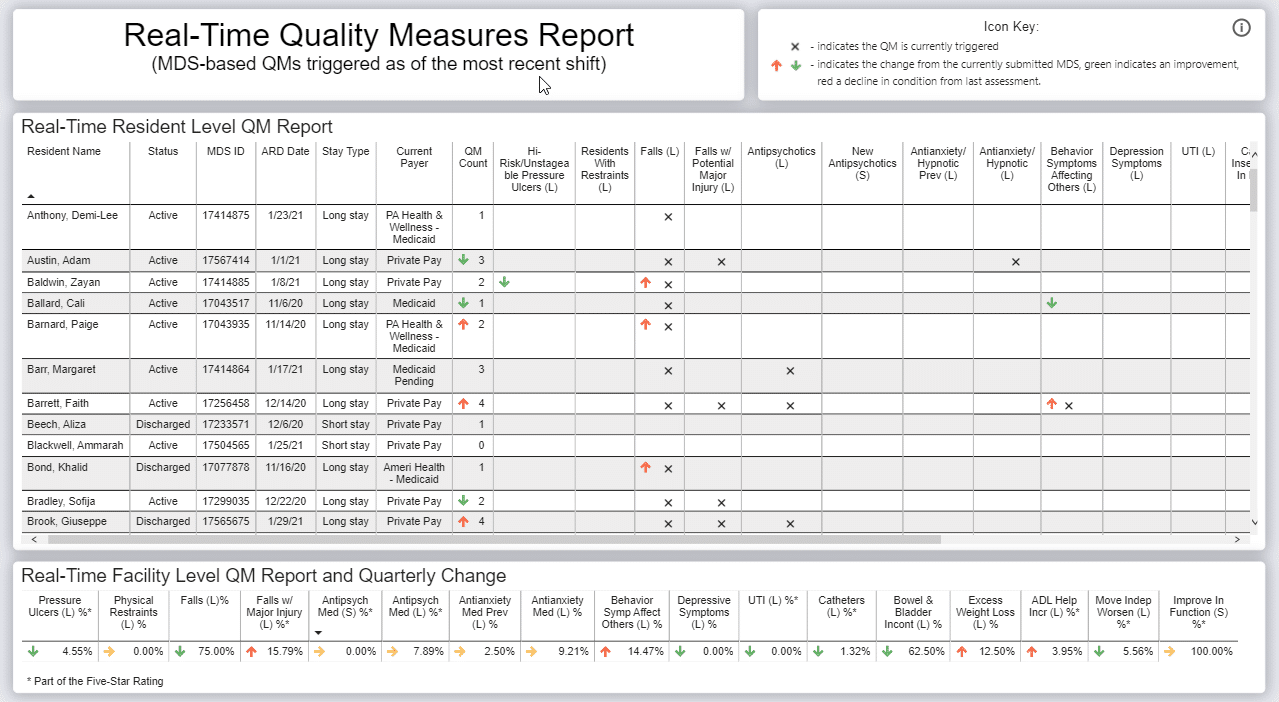
Resident-Level and Facility QM Analysis
Get quality measure detail for each individual resident and facility-wide percentages to spot trends and better manage staff resources.
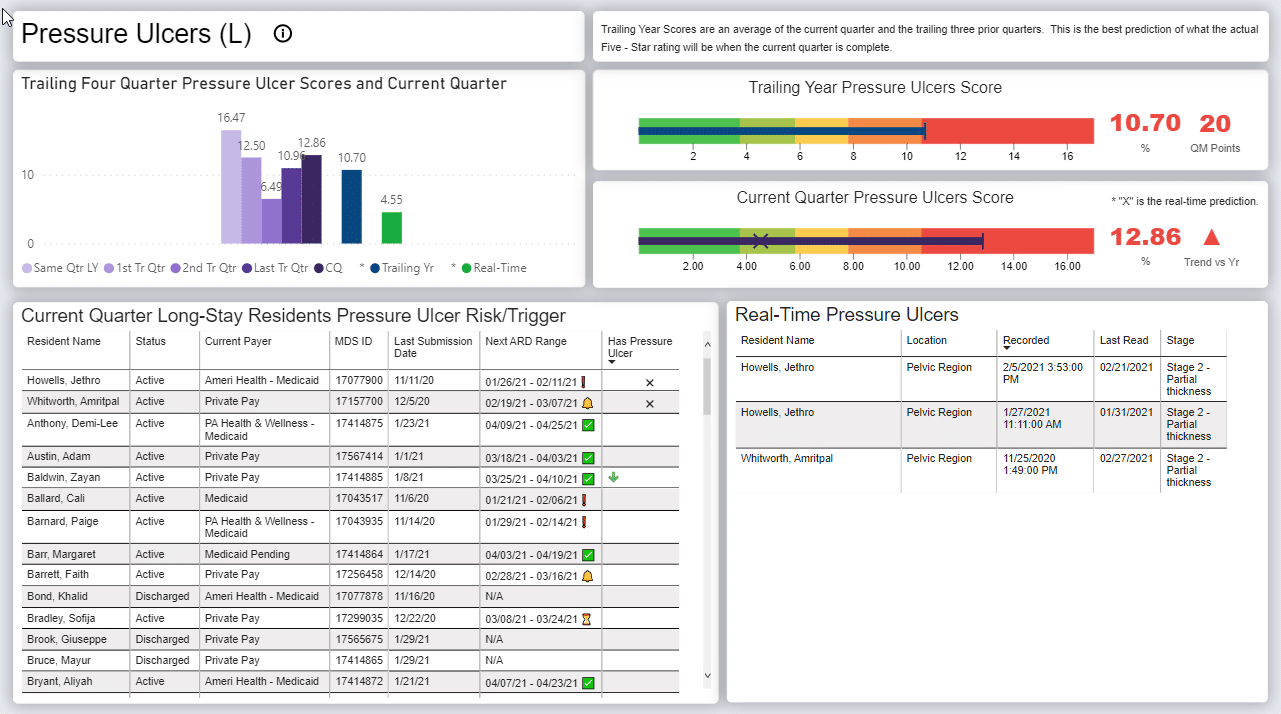
Focused Reports on Each Quality Measure
Whether it be falls, pressure ulcers, or catheter usage, the dashboard gives you the granular detail you need to determine next steps for each resident.
This dashboard not only allows me to compare my facility with my local competition, but it allows me to precisely pinpoint and identify the areas that need improvement for us to reach the next level.
Melissa Frownfelter, VP of OperationsPleasant View Communities, Manheim, PA