Dashboard
Financial Analysis for SNFs
Are you tired of static, stale, black and white financial reports?
Do you know where you stand before month-end close?
Do you need a reporting solution that can be used both in the boardroom and by department managers?
The Financial Analysis for SNFs Dashboard integrates with your ERP, EMR, payroll, and other systems to give you fully interactive, real-time financial reports.
Dashboard Features
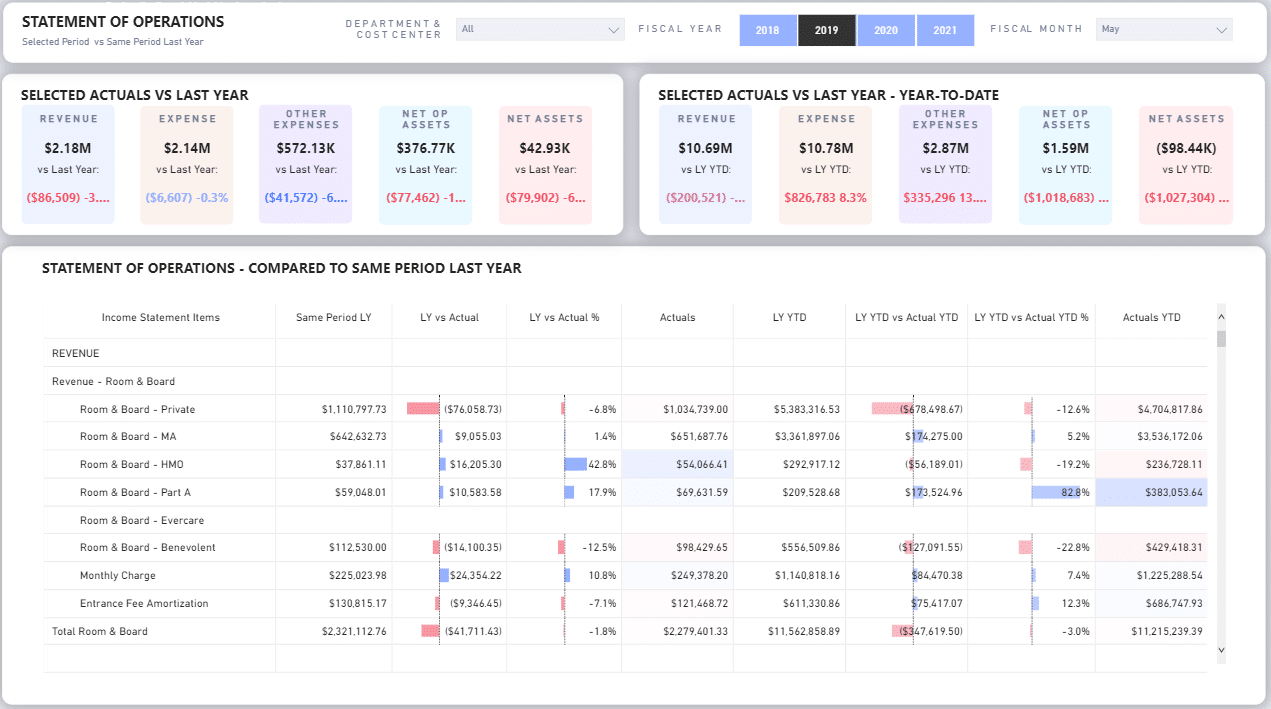
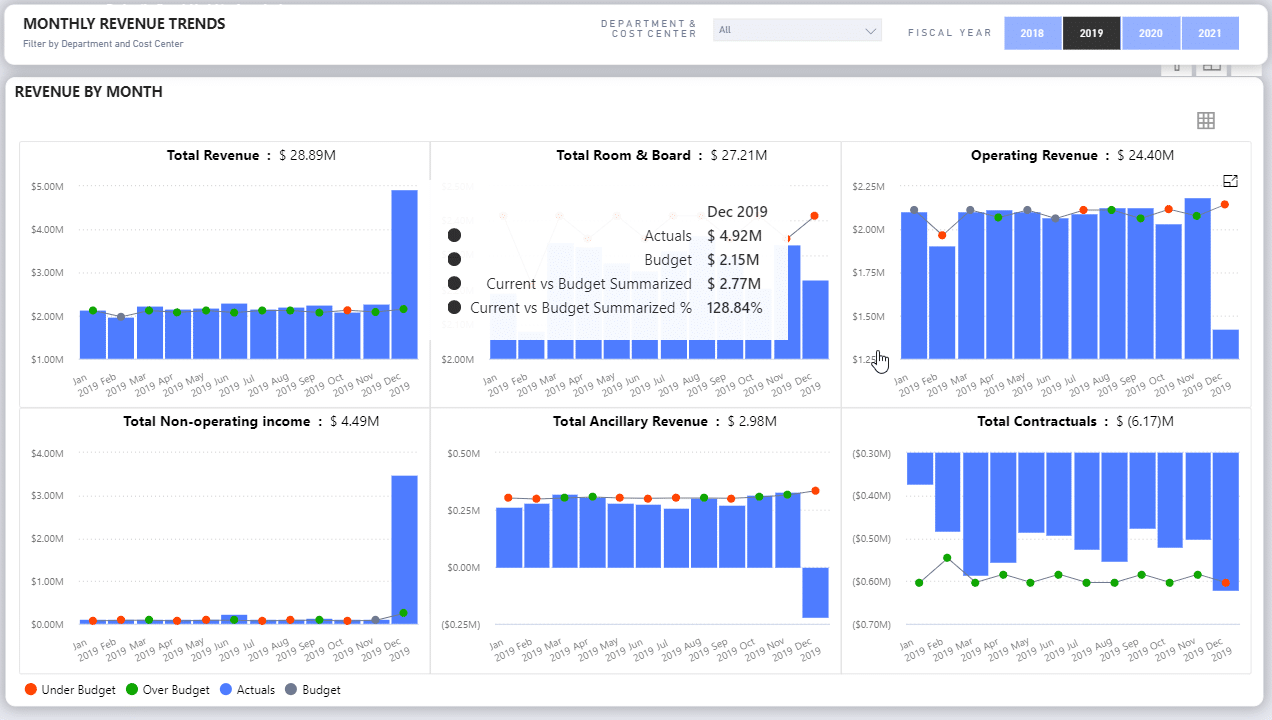
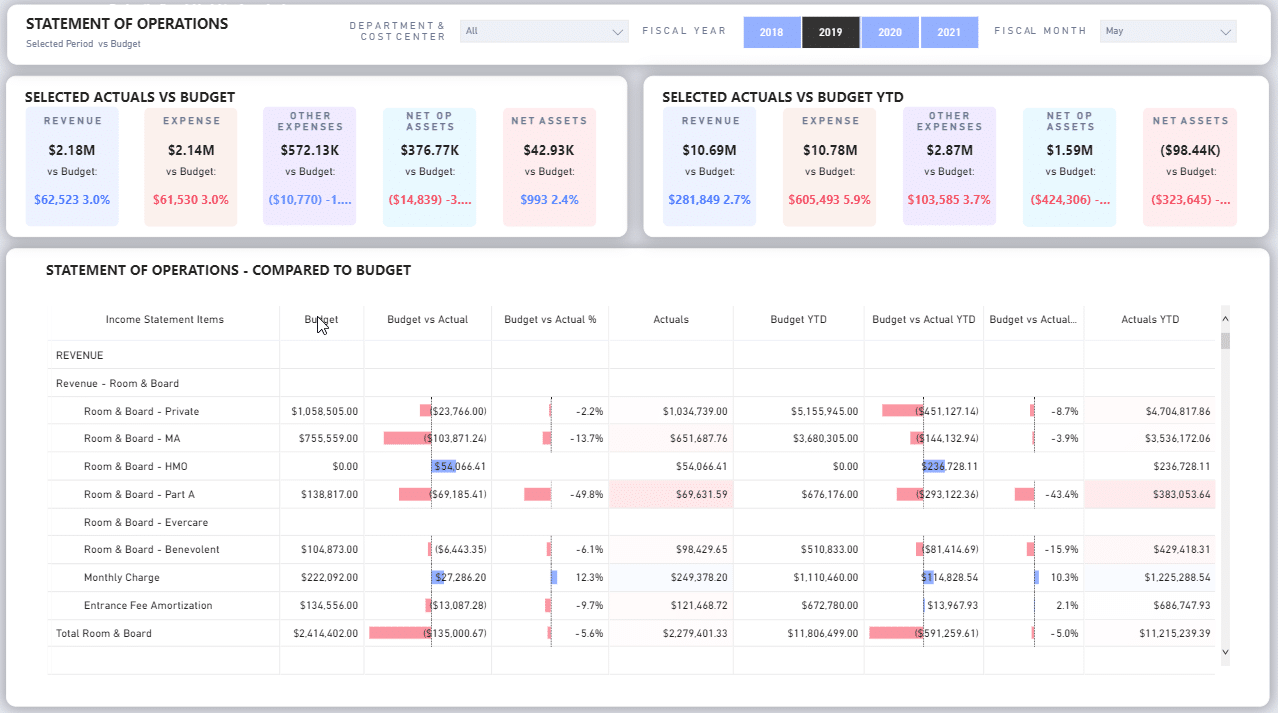
Real-Time Statement of Operations
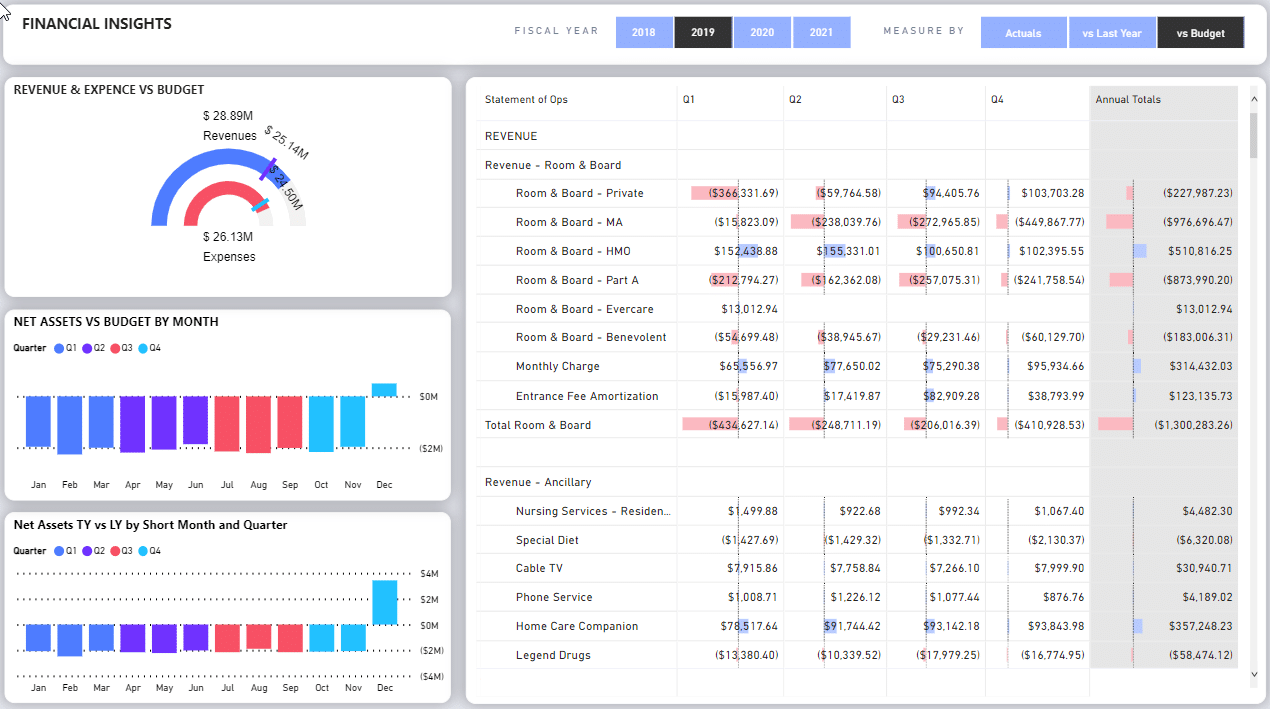
See actuals vs. budget for each line item and quickly filter by any department or cost center.
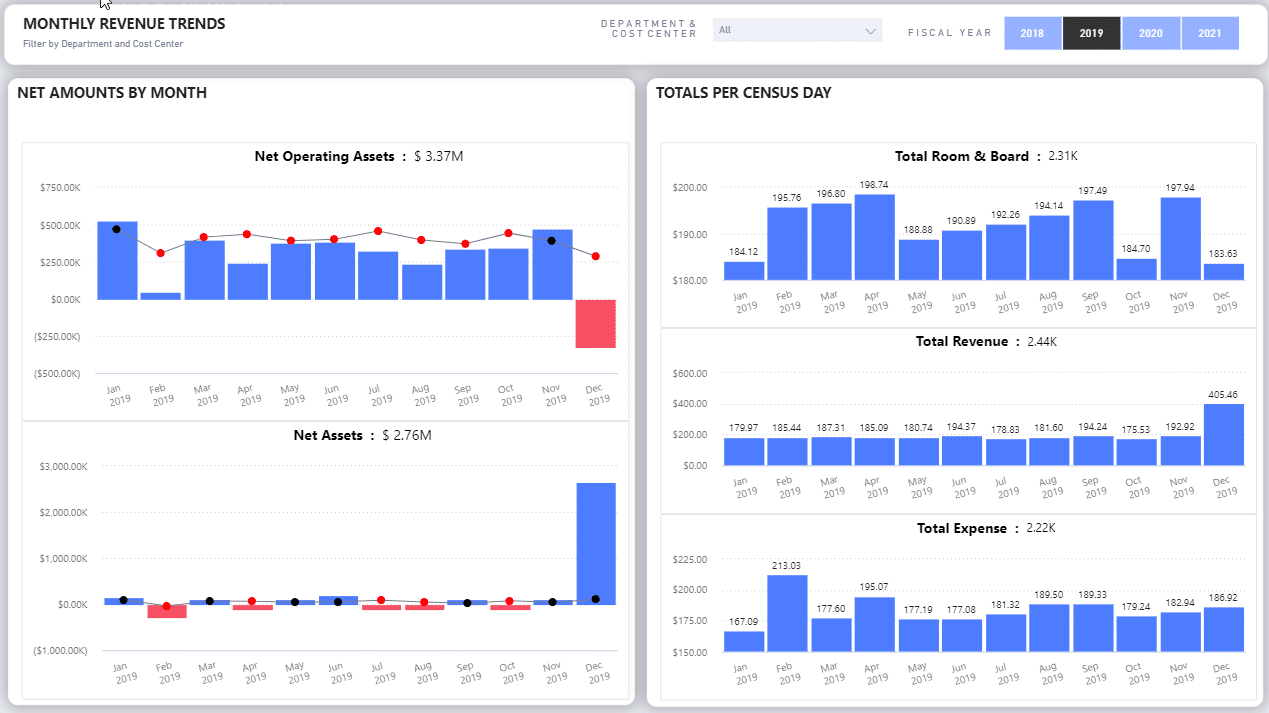
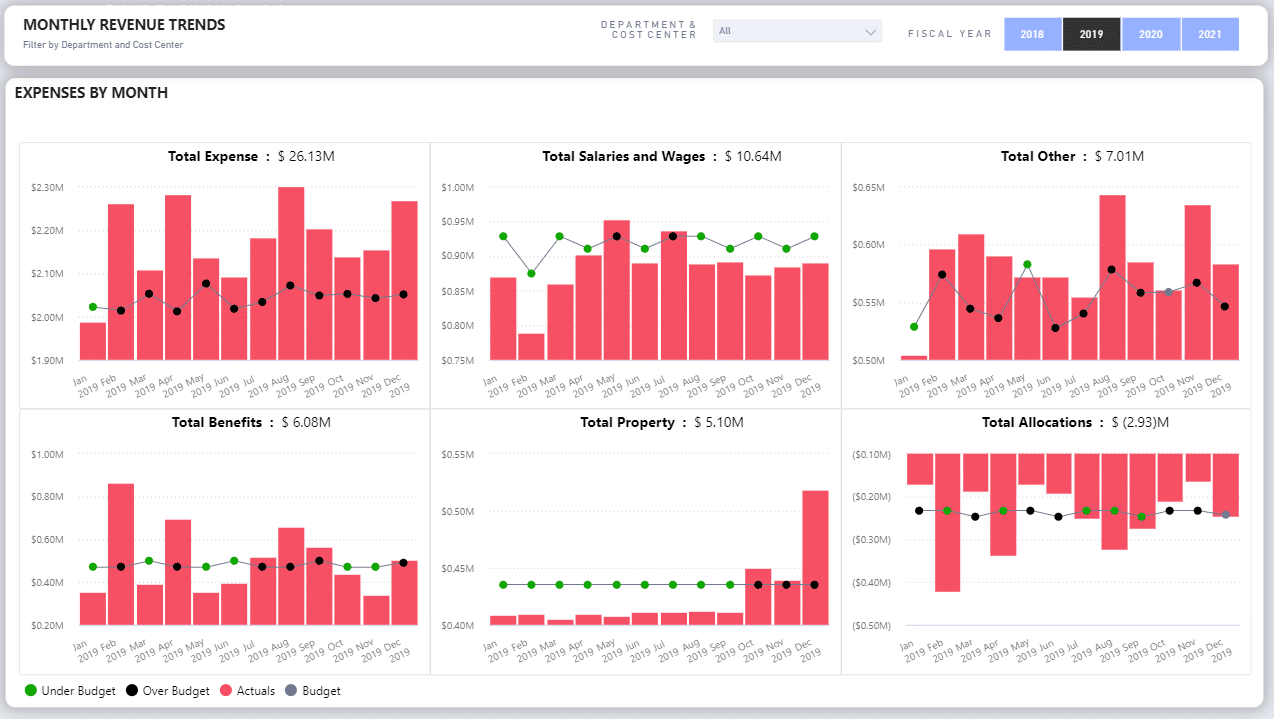
Trend Analysis
No need to wait until month-end close to see where actuals are exceeding or falling short of budget. Quickly zero in on the cause of revenue or expense spikes.
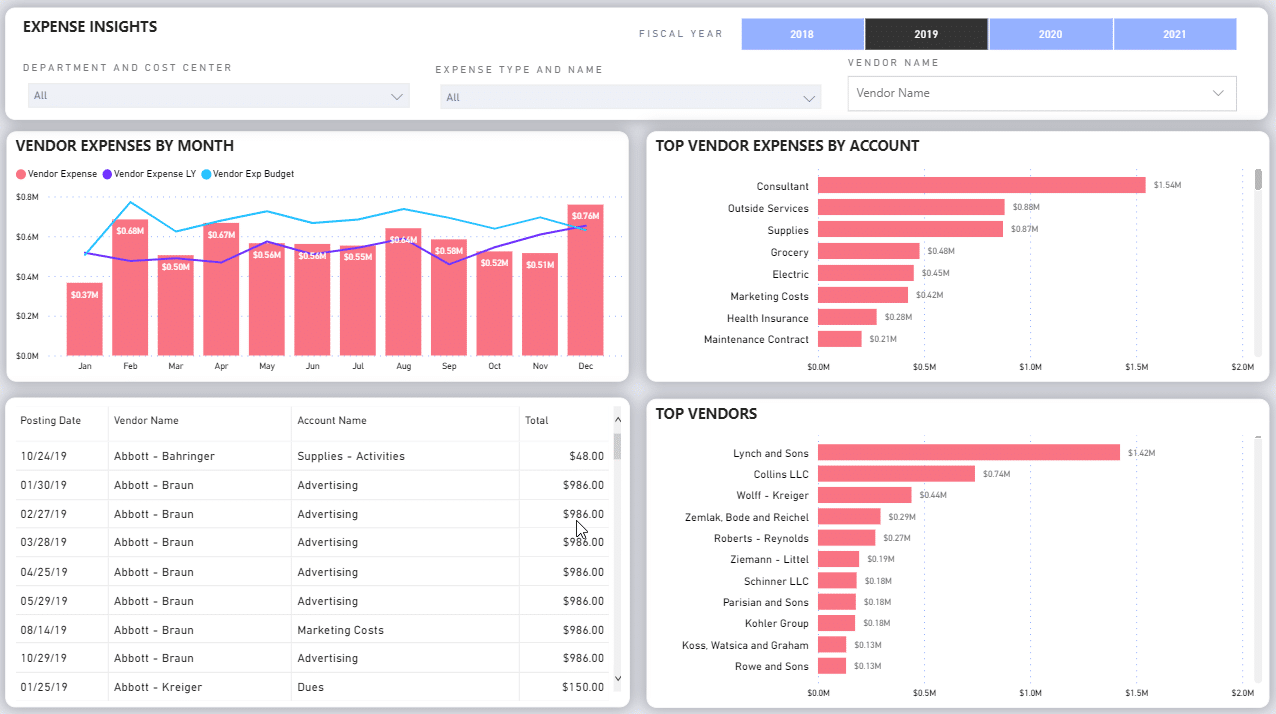
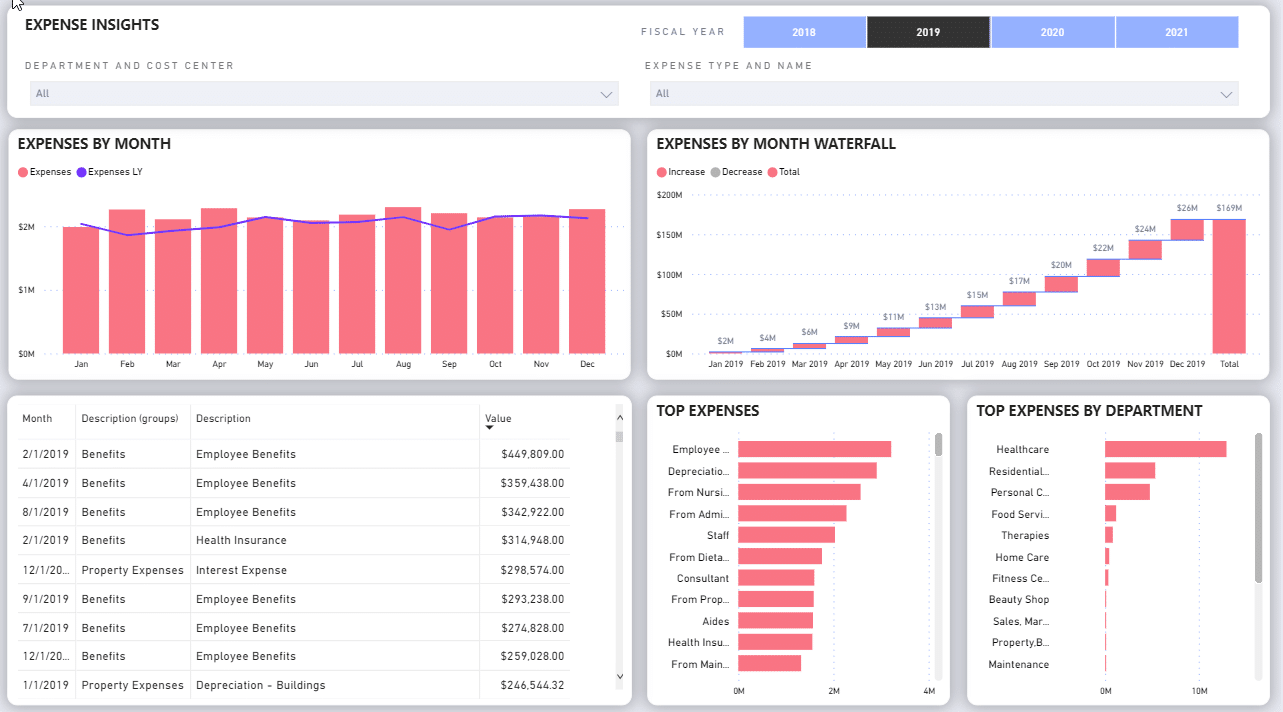
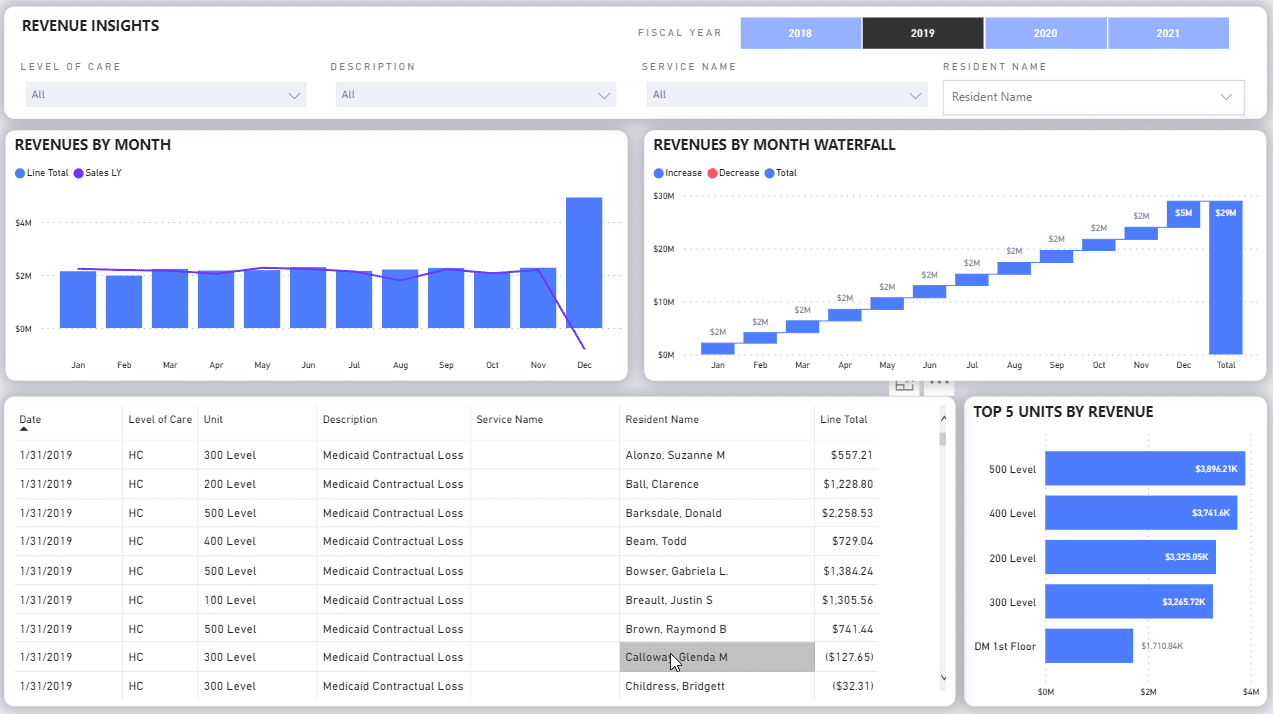
Resident-Specific Revenue/Expense Analysis
Drill down to revenue and costs for any resident, department, or vendor.
Fully exportable data
Export data from any individual visualization to Excel to do your own in-house analysis.
This dashboard not only allows me to compare my facility with my local competition, but it allows me to precisely pinpoint and identify the areas that need improvement for us to reach the next level.
Melissa Frownfelter, VP of OperationsPleasant View Communities, Manheim, PA