
From 80 reports that disagreed to one set of numbers
DashPoint Analytics is moving an online education provider from about 80 separate reports, each with its own math, to one shared set of numbers, starting with a scorecard of the 14 measures leadership watches most.
14 KPIs leadership metrics on one trusted tracker
The problem
An online education provider had about 80 reports, each pulling and calculating its own numbers from the same handful of systems. The same figure came out differently in different reports, and nobody could tell which one was right.
What we built
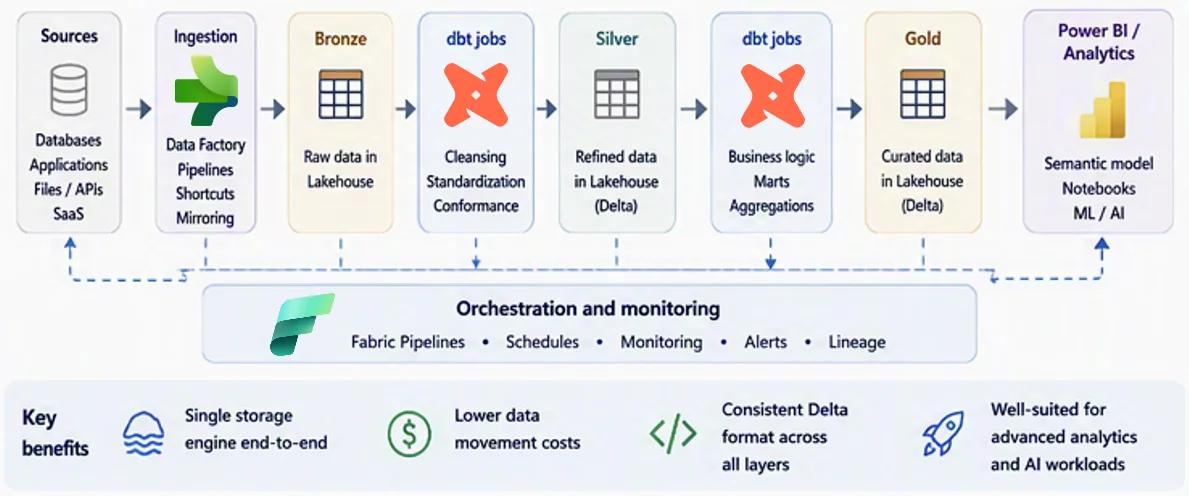
One central data platform that collects data from every system, cleans it, and calculates each number one way. Changes are tested in a practice copy before they go live. The nightly update checks itself, and if one system sends bad data it stops and alerts the team instead of quietly showing stale numbers.
Outcome
Each number now has one definition. Leadership tracks 14 key measures from one trusted scorecard, and there is a clear, repeatable path for moving the remaining reports.