
What does moving from Power BI Pro to Microsoft Fabric actually involve?
Moving from Power BI Pro to Fabric is mostly data engineering: pull the logic out of each report's dataflows, agree on one definition per metric, rebuild it once in shared lakehouse tables with Git and dev/prod, and reconcile against the old numbers before cutover.
Moving from Power BI Pro to Microsoft Fabric is mostly a data engineering project. The reports are the easy part. The real work is pulling the business logic out of dozens of separate dataflows, agreeing on one definition for each metric, and rebuilding that logic once in shared lakehouse tables that every report reads.
If you treat it as a licensing upgrade, you get the same conflicting numbers on a more expensive platform.
Why companies outgrow Power BI Pro
Pro setups usually grow one report at a time. Each report gets its own dataflow or Power Query steps, written by whoever needed it that month. After a few years the problems look familiar:
- Two reports show different revenue, enrollment or headcount for the same month, and nobody can say which is right.
- No one can see which source feeds which report.
- A change in a source system breaks reports quietly.
- Refreshes and gateways are managed by the one person who knows the history.
That is where a K-12 online education provider we work with started: about 80 Power BI Pro reports, each with its own dataflow logic, pulling from SQL Server, SharePoint and marketing data. The full story is on the education migration case study.
What the move involves
- Inventory what exists. List every report, its sources and the logic inside its dataflows. This is where duplicate and conflicting metric definitions show up.
- Decide definitions with the business. Which version of “active customer” or “net revenue” is correct is a business decision. Engineering can surface the differences; finance or operations has to pick.
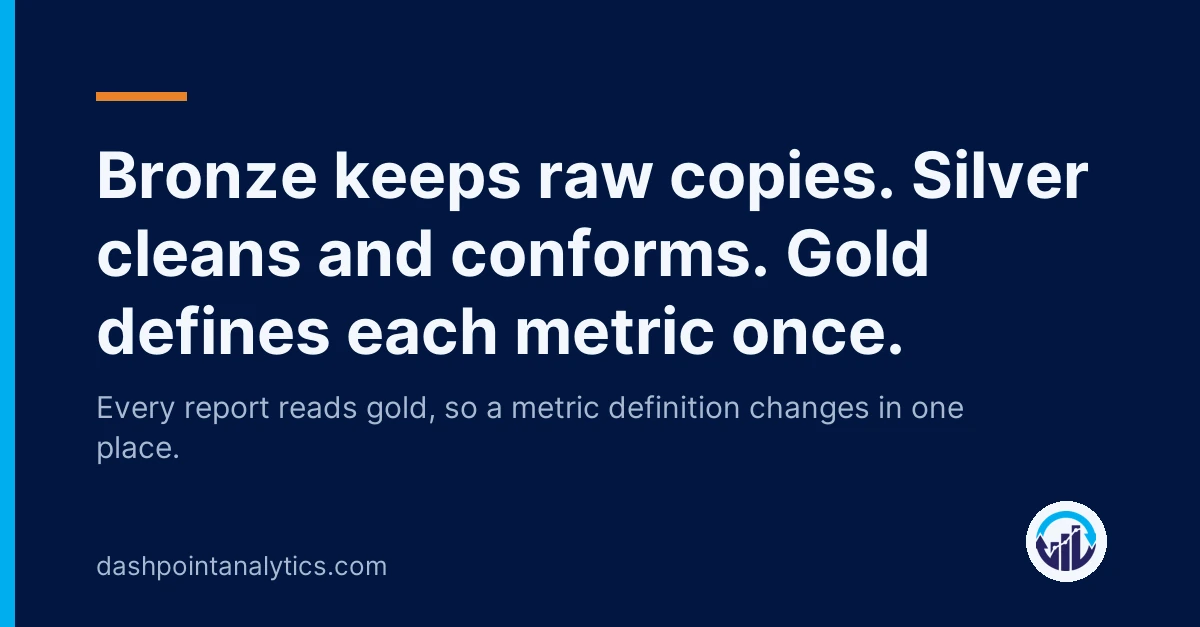
- Build the medallion layers in a lakehouse. Bronze holds raw copies of source tables. Silver holds cleaned, conformed tables built in Spark notebooks. Gold holds the tables reports read, with each metric defined once. On the education platform, bronze ingestion is manifest-driven: one file lists every source table, so adding a source is a configuration change.
- Put it in Git with dev and prod. Separate dev and prod workspaces connected to Git, with variable libraries for the settings that differ between environments. Changes are reviewed and promoted, so nobody edits production live.
- Orchestrate and monitor. A nightly pipeline with health checks. The education platform uses a circuit breaker: if one source is bad, the run fails fast instead of silently loading bad data or leaving reports on stale data without anyone noticing.
- Rebuild reports on gold, in priority order. Direct Lake semantic models read gold tables in OneLake directly. Start with the reports leadership uses most. On the education project the first deliverable was a 14-KPI executive tracker on shared gold tables, and the remaining reports follow the same repeatable path.
- Reconcile before cutover. Put the old numbers next to the new ones, by month and by the dimensions the business reports on. On a healthcare revenue cycle platform we built, gold totals reconcile to the legacy system within about 1%. Differences you cannot explain are usually business rules nobody wrote down.
What it costs in time and effort
Effort depends more on the number of distinct sources and how much the definitions disagree than on the number of reports. Eighty reports reading three sources with mostly shared logic is a smaller job than twenty reports on twelve sources with conflicting rules.
Plan for three costs beyond engineering:
- Capacity. Fabric runs on a capacity (an F SKU) that you pay for whether or not it is busy. Size it from real workloads: data volume, notebook and pipeline runs, and how many people use reports at once. Below F64, people who view reports still need Power BI Pro licenses, so most mid-market companies keep their Pro licenses after the move. Microsoft’s Fabric licensing page has the details.
- Business time. Definition decisions need the people who own the numbers. A few focused sessions with finance and operations early on save weeks of rework later.
- Parallel running. Old and new run side by side while you reconcile. Budget for that overlap.
Engineering effort is front-loaded. The first gold tables, the pipeline and the deployment process take the most time. After that, each additional report gets cheaper because it reads tables that already exist.
Common mistakes
- Moving dataflows as they are. Copying each Pro dataflow into Fabric one for one keeps every conflicting definition you already have.
- Starting with all the reports. Pick the reports leadership looks at every week, prove the numbers, then expand.
- Leaving Git and deployment for later. Adding dev and prod to a platform people already depend on is harder than starting with it.
- Letting the pipeline succeed with bad data. With Direct Lake, bad gold data reaches executives as soon as it lands. Checks before gold are cheap.
- Sizing capacity on a guess. Run a pilot workload and watch it in the Capacity Metrics app before committing to a SKU.
- Treating reconciliation as optional. If finance cannot tie the new number to the old one, they will keep using the old report.
A practical next step
Before talking to any partner, do the inventory yourself. Build a spreadsheet with one row per report: owner, sources, refresh schedule and the three or four metrics it shows. Then mark every metric that appears in more than one report.
That sheet tells you how many sources you have, where definitions conflict and which reports matter most. It is also most of what anyone needs to size capacity and estimate the build.
If you want a second opinion on it, our Fabric assessment covers your sources, the capacity you need and a build plan with costs. You can reach us through the contact page.